
When I have had to investigate a slow node in production, the metrics and logs only take me so far. They show that latency has gone up, but not what the threads inside Cassandra are doing at the time. To answer that you need a profiler, and on a production cluster that has always been the hard part.
Cassandra 6.0 now has one built in, this post covers what has been added, how to enable it, how to read the results and the things I found while testing it.
What shipped in CASSANDRA-20854
Following a presentation at Community over Code by Bernardo Botella Corbi, I have been looking at CASSANDRA-20854, which brings the async-profiler into Cassandra itself. In my experience, getting a profiler onto a production node is often impossible. Change control, locked-down hosts and security policy rule out downloading and attaching a third-party tool, so you end up trying to recreate the problem in a test environment. That is slow, and some problems only ever appear under production load.
Before going any further, this is not in a released version yet. The change is in 6.0, so you will need to build Cassandra from source to follow along. The in-tree documentation covers each command, and the pull request is worth reading for the review discussion around duration limits and safety.
Once you are on a build that includes it, most of the installation problem goes away. async-profiler 4.2 is now a regular dependency, so the jar sits in Cassandra’s lib directory alongside everything else. It carries the native libraries for Linux on x86-64 and ARM64, plus macOS for local testing, so there is nothing extra to install on the host.
On top of the library there are two layers. The first is a JMX MBean, registered as org.apache.cassandra.profiler:type=AsyncProfiler, which starts and stops a profiling session and manages the result files. The second is a new nodetool profile command group that wraps the MBean. Between them you can start a profile, check on it, list the results and fetch a file back to the machine you ran nodetool from, without logging on to the node.
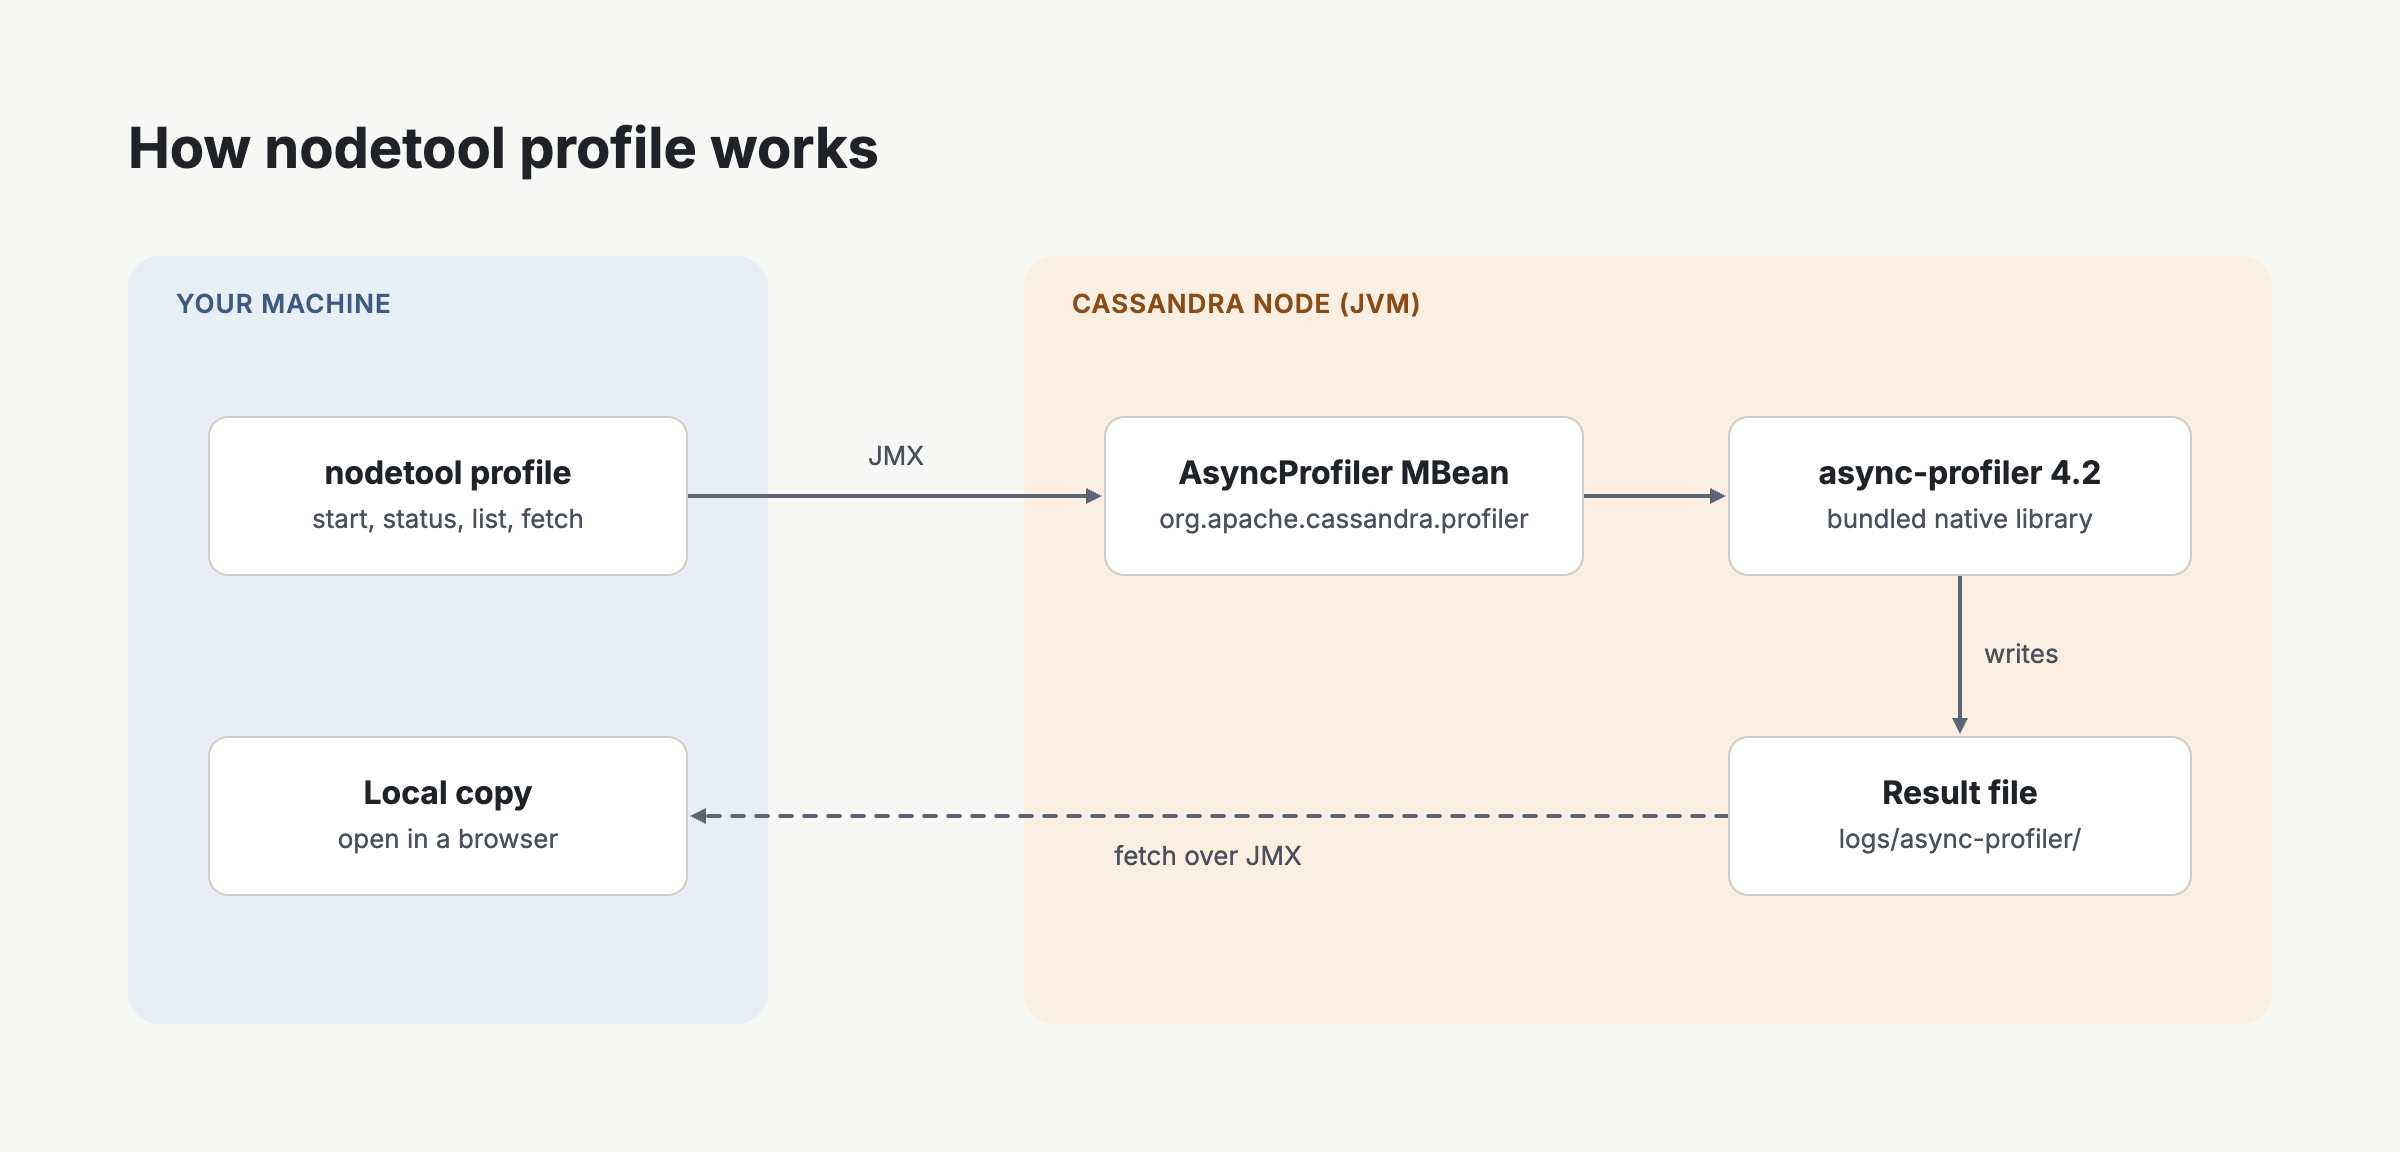
The feature is disabled by default. Nothing happens until you set a system property and restart the node, which I cover in the next section.
There is also a new check on the host’s kernel settings. When the profiler is enabled, Cassandra reads kernel.perf_event_paranoid and kernel.kptr_restrict at startup and logs a warning if they are too restrictive. They affect what a CPU profile can see rather than whether the profiler runs, which I cover in the next section.
Enabling it
The profiler is switched on with a JVM system property, not a cassandra.yaml setting. Add this line to conf/jvm-server.options on each node you want to profile:
-Dcassandra.async_profiler.enabled=trueThe property is only read at startup, so the node needs a restart before it takes effect. On a production cluster that means planning a rolling restart.
Result files are written to an async-profiler directory under the Cassandra log directory. If you want them somewhere else, set a second property:
-Dcassandra.logdir.async_profiler=/var/log/cassandra/async-profilerThe directory has to be writable by the user Cassandra runs as. I would leave the default unless your log volume is small, as a long JFR recording can take up a lot of space.
There is a third property, cassandra.async_profiler.unsafe_mode, which allows raw profiler commands. Leave it off. I cover why in the section on production guardrails.
The host needs some preparation as well. For CPU profiles to include kernel frames, two kernel settings have to allow it:
echo 'kernel.perf_event_paranoid = 1' | sudo tee /etc/sysctl.d/99-async-profiler.conf
echo 'kernel.kptr_restrict = 0' | sudo tee -a /etc/sysctl.d/99-async-profiler.conf
sudo sysctl --system
The first two commands write the settings to a file so they survive a reboot, and the third applies them straight away. Whether you will be allowed to make this change is another matter. Relaxing kernel security settings on a production host is the kind of request that can be impossible to get approved, for the same reasons that installing a profiler was. If you cannot get it changed, the profiler still runs, but CPU profiles will not show what the kernel is doing.
If they are not set, Cassandra logs a warning at startup. Once CASSANDRA-21876 is in, the profiler still runs without them, but CPU profiles lose their kernel frames, so you only see the Java side of time spent in system calls. alloc and lock record Java stacks only, so they are not affected.
When I tested it, the check was stricter. On a build without that fix, nodetool profile start refuses to run:
$ nodetool profile start -d 2m
nodetool: Async-profiler experience likely affected. Kernel symbols are unavailable due to restrictions. Try 'sysctl kernel.perf_event_paranoid=1' and 'sysctl kernel.kptr_restrict=0' or its variation on your system to resolve the issue.
See 'nodetool help' or 'nodetool help <command>'.
Nothing is recorded, and nodetool profile status still reports that the profiler is not active. Ubuntu’s defaults fail this check, so expect to see it on a fresh install. The settings are read each time you start a profile, so once they are changed you can try again without restarting Cassandra.
If you run Cassandra in containers, the seccomp profile also needs to allow the perf_event_open system call.
Once the node is back up, nodetool profile status confirms the profiler loaded. With no session running it returns:
Profiler is not activeThat is the expected response, not an error. If the profiler did not load, you will see Async-profiler native library is not enabled or not possible to load. instead, and system.log will tell you why.
Your first profile
With the profiler enabled, the quickest way to see it working is to run it with no options at all. I am running nodetool from a separate machine here, which is the whole point of the feature, so each command uses -h to point at the node ( note: I have missed out the user id and password from these commands for obvious reasons) :
nodetool -h 10.0.1.23 profile startThis starts a 60 second CPU profile and returns straight away. It prints nothing if it succeeds. The profile runs in the background on the node, and the result is written as an HTML flame graph named after the date and time, for example 2026-10-19-20-35-03.html. That timestamp comes from the clock of the machine running nodetool, not the node, which is worth knowing if the two are in different time zones.
While it runs, you can check on it:
nodetool -h 10.0.1.23 profile statusProfiling is running for 4 secondsOnly one profiling session can run on a node at a time. If you try to start a second one before the first finishes, nodetool refuses and exits with an error:
Profiler has already started or there was a failure to start it.The result file is only written when the profile finishes, so it does not show up in the list while the session is still running. Once the 60 seconds are up, it appears:
nodetool -h 10.0.1.23 profile list2026-10-18-16-17-15.html
2026-10-19-20-35-03.htmlTo get the file back, use fetch with the remote file name and a local path:
nodetool -h 10.0.1.23 profile fetch 2026-10-19-20-35-03.html ./node3-cpu.htmlThis copies the file over JMX to the machine you ran nodetool from, and again prints nothing if it succeeds. Open it in a browser and you have a flame graph from a production node without having logged on to it, installed anything or copied files around by hand. I explain how to read it later in the post.
The file stays on the node after you fetch it. Results are not cleaned up automatically, so it is worth getting into the habit of clearing them once you have what you need:
nodetool -h 10.0.1.23 profile purgeThis removes every result file on the node, so make sure you have fetched anything you want to keep first.
The command reference
That covers the everyday workflow. For reference, these are all the subcommands in the nodetool profile group:
| Command | What it does | Needs the profiler enabled |
|---|---|---|
start | Starts a profiling session in the background | Yes |
stop | Ends the running session early and writes the result | Yes |
status | Shows whether a session is running and for how long | Yes |
list | Lists the result files on the node | No |
fetch <remote> <local> | Copies a result file to the machine running nodetool | No |
purge | Deletes every result file on the node | No |
execute <command> | Passes a raw command to async-profiler; only works with unsafe_mode on | Yes |
Running nodetool profile on its own is the same as nodetool profile start with the defaults. list, fetch and purge work even when the profiler is disabled, so you can still collect and clear old results after turning it off.
Most of the options are on start:
nodetool profile start [-e EVENTS] [-d DURATION] [-f FORMAT] [-o FILENAME]| Option | Default | Values |
|---|---|---|
-e, --event | cpu | cpu, alloc, lock, wall, nativemem, cache_misses, comma separated |
-d, --duration | 60s | A duration such as 30s, 5m or 1h |
-f, --format | flamegraph | flat, traces, collapsed, flamegraph, tree, jfr |
-o, --output | A timestamp, for example 2026-10-19-20-35-03.html | A plain file name |
There is no upper limit on the duration. I tried -d 12h and it was accepted. A longer run does not make a bigger flame graph. The file grows with the number of different code paths the profiler sees, not with time, so a long HTML profile stays a manageable size. JFR recordings are different, as they store every sample and grow the longer they run, which matters when they have to come back through fetch. Even so, I would keep profiles to minutes rather than hours. If you need to watch a node for hours, that is continuous profiling, and it is better done another way.
The events are covered in the next section. Of the formats, flamegraph is the one I use most, as it gives you a single HTML file you can open in any browser. jfr is the one to use when you profile more than one event at a time, or want to open the result in JDK Mission Control.
The output name is just a file name, not a path. Every result goes into the profiler directory on the node. Names are checked against a strict pattern: letters, numbers and dashes, with at most one dot. Underscores are not allowed, which caught me out:
$ nodetool profile start -d 2m -e wall -o test_1.html
nodetool: Output file name must match pattern ^[a-zA-Z0-9-]*\.?[a-zA-Z0-9-]*$.
See 'nodetool help' or 'nodetool help <command>'.
So node3-wall.html works, but node3_wall.html and node3.wall.html do not.
Name the file to match the format. The default name only switches to .jfr when you ask for JFR. If you choose collapsed, flat or traces and leave off -o, you get a plain text file with a .html extension.
stop takes the same -o option, which sets the name of the file it writes:
nodetool -h 10.0.1.23 profile stop -o node3-cpu.htmlEvery subcommand exits with a non-zero status when it fails, so they can be used in scripts without having to parse the output.
Choosing the right event
The -e option decides what the profiler records, and choosing the right one matters more than any other option. Each event answers a different question, and a profile of the wrong event can look perfectly healthy while the problem sits somewhere it was never looking.
cpu
A CPU profile asks what the CPU is doing. At each sample, async-profiler records the stacks of the threads that are running on a CPU at that moment. A thread that is asleep, waiting on a lock or waiting for a disk read is not using the CPU, so it never appears.
This is the default, and it is the right choice when the complaint is that a node is using too much CPU. It shows you which code paths the CPU time is going to, for example compaction, the read path or serialization.
wall
A wall-clock profile asks what every thread is doing. The name comes from the clock on the wall, meaning real elapsed time. At each sample, async-profiler records threads whether they are running or not. A thread blocked on a lock is recorded at the lock, a thread waiting for a disk read is recorded in the read, and a thread with nothing to do is recorded where it parks.
The difference matters most for latency. Take a read that takes 200 ms but only uses 5 ms of CPU, and spends the rest waiting for the disk and for replies from other replicas. A CPU profile sees the 5 ms and very little else. A wall profile sees the whole 200 ms, and the wide stacks show where the waiting happened. When the complaint is that p99 latency has gone up, wall is usually the better place to start.
The cost is that idle threads count as well. A JVM has a lot of threads that spend most of their time waiting, so on a healthy node they fill most of the graph. I show what that looks like in the next section.
A simple way to remember the difference: in a CPU graph, wide means busy doing this. In a wall graph, wide means spending a lot of time here, either working or waiting.
alloc
An allocation profile records where objects are being created on the Java heap. Use it when GC pauses or GC frequency go up and you want to know what is producing the garbage.
lock
A lock profile records where threads are waiting to acquire a lock that another thread holds. Use it when you suspect contention, for example threads queueing behind the same synchronized block.
nativemem and cache_misses
nativemem records allocations made outside the Java heap, which is useful when you are chasing growth in off-heap memory. cache_misses uses the CPU’s hardware performance counters to record where the CPU is waiting on memory. Most virtual machines do not expose those counters, so do not be surprised if it is not available on a cloud instance.
Choosing between them
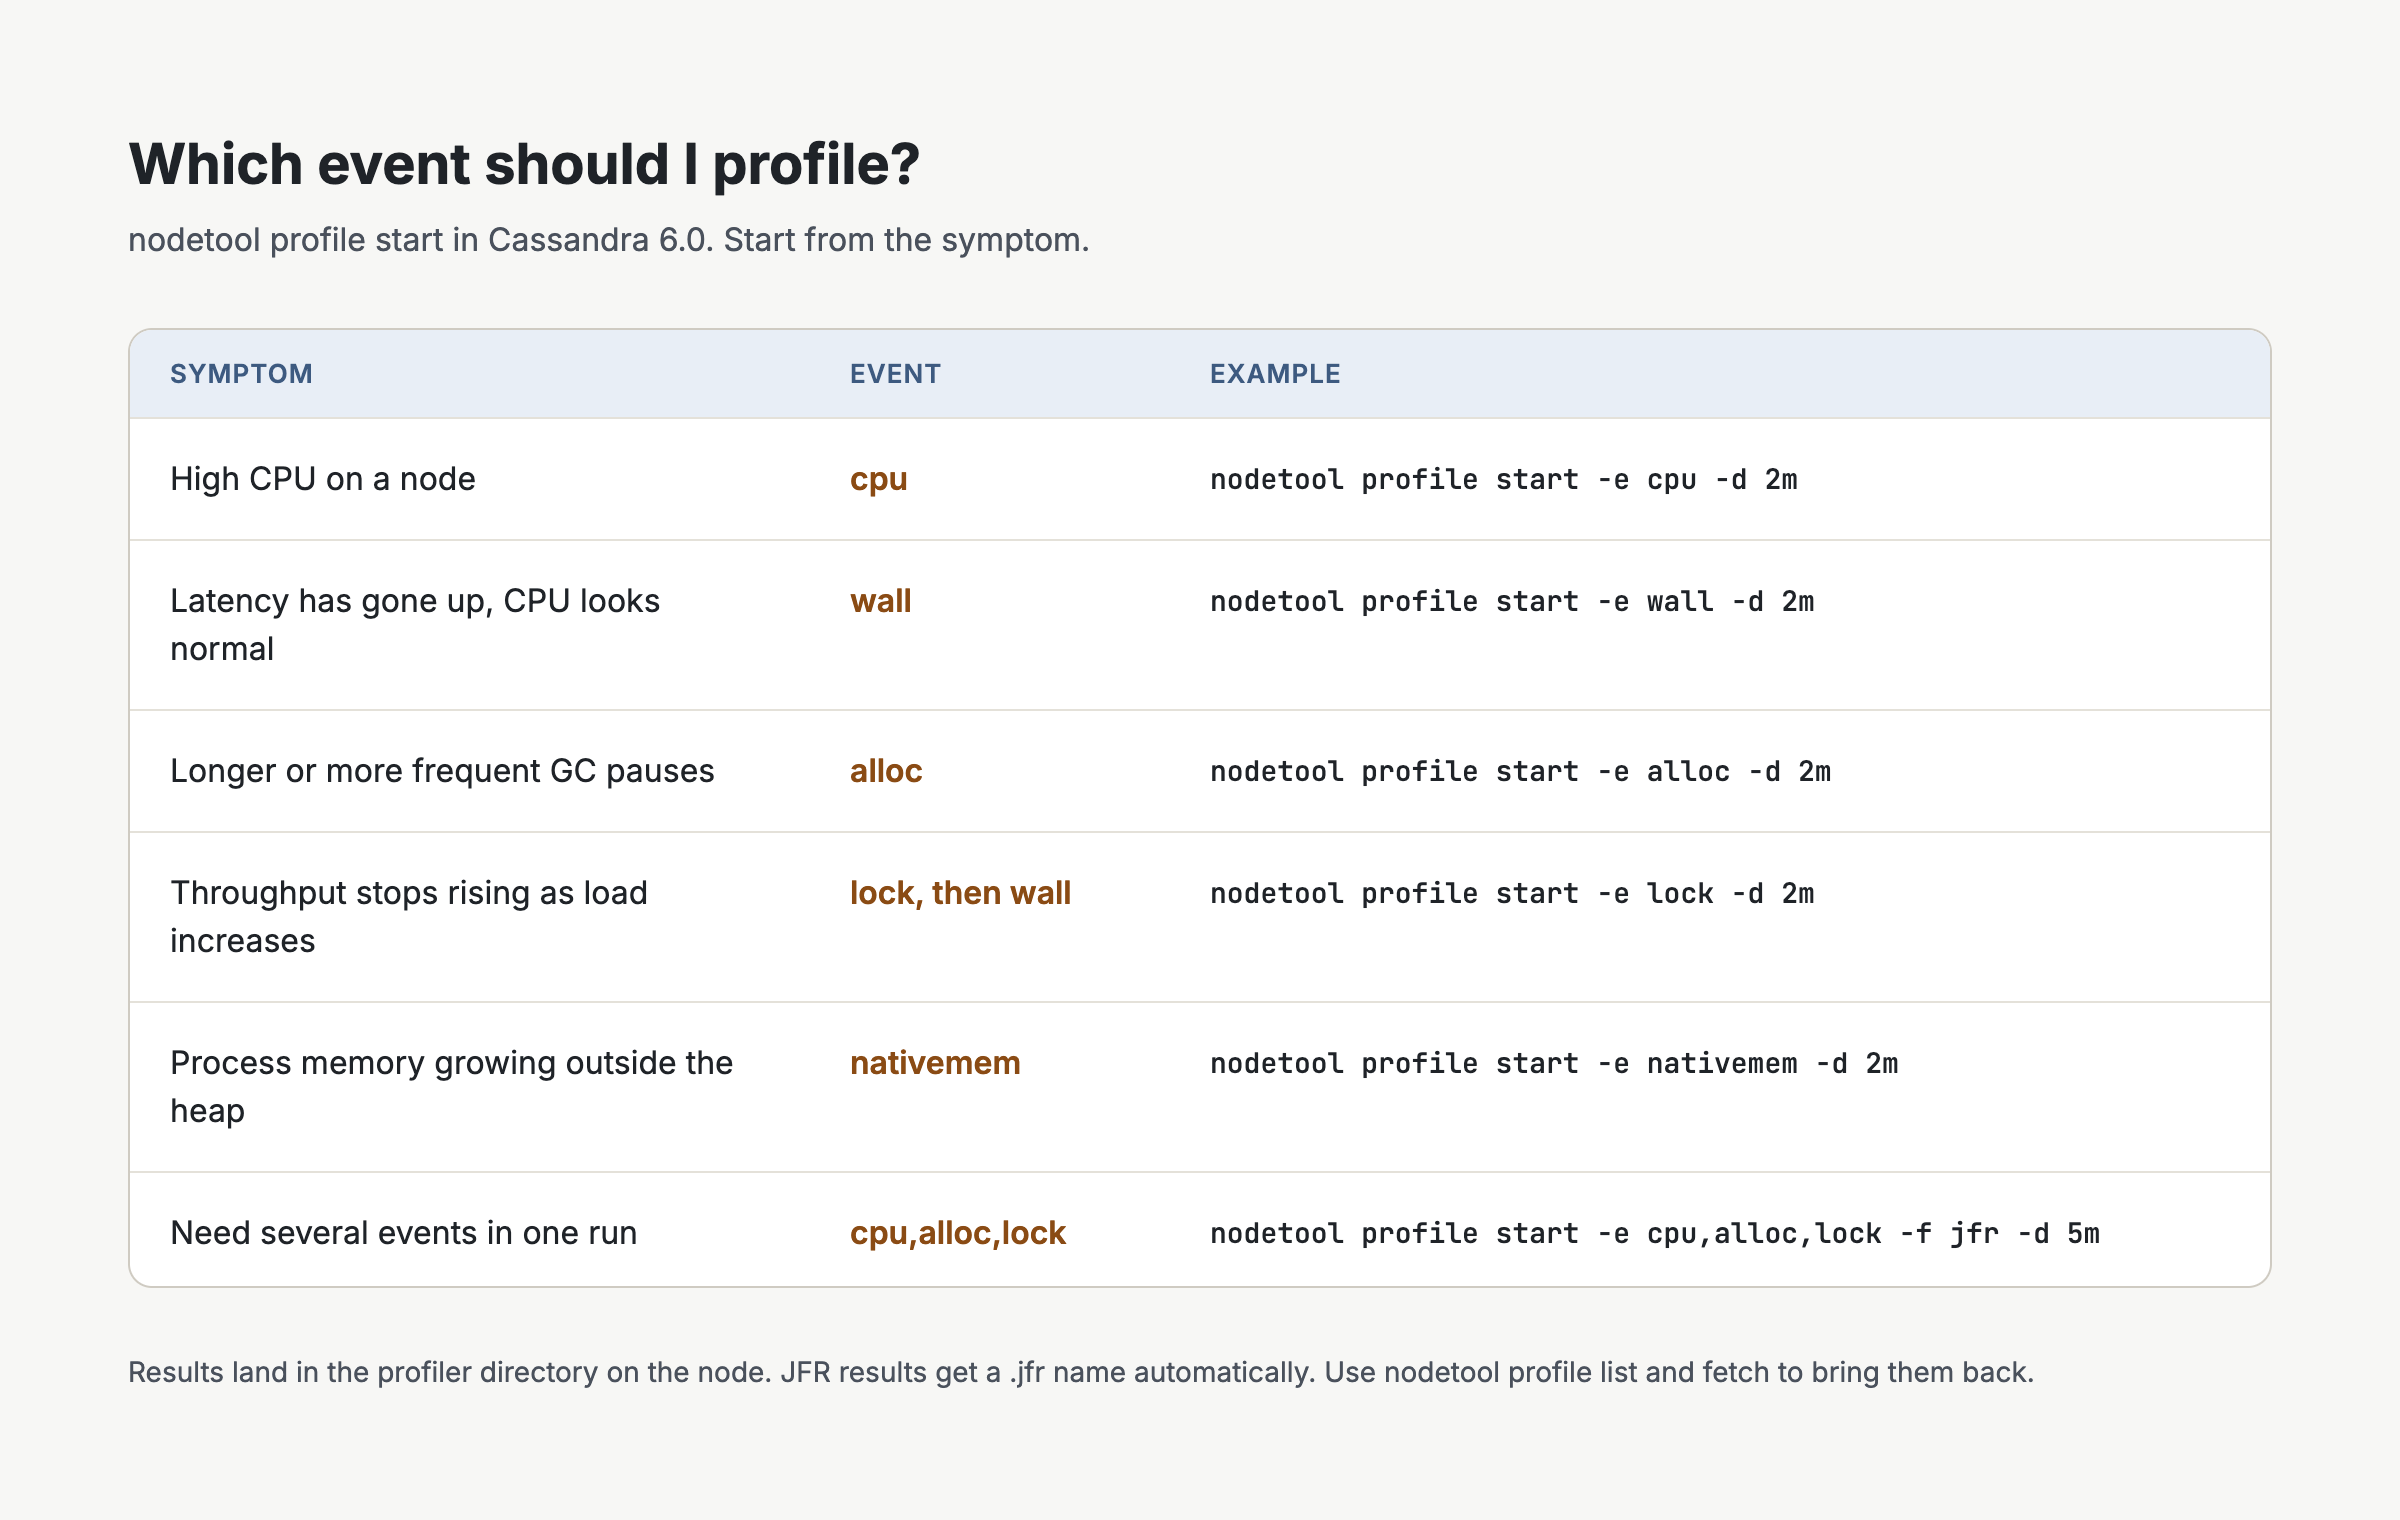
You can record more than one event in a single session by separating them with commas, but an HTML flame graph can only show one event at a time. If you combine events, use -f jfr and split them afterwards on your own machine:
nodetool profile start -e cpu,alloc,lock -f jfr -d 5m -o node3-mixed.jfrReading a flame graph
If you have not used a flame graph before, the layout takes a minute to get used to. Each box is a method, or a function in the JVM or the kernel. The bottom row is where a thread starts, and each box above is something the one below it called. The width of a box is the share of samples where that method was on the stack. A wide box near the top is where the CPU was actually being spent.
Something to note, the horizontal axis is not time. Boxes at each level are sorted alphabetically, so left and right tell you nothing about when something happened. The colours tell you what kind of code a frame is: green for Java, aqua for Java methods the JIT compiler has inlined, yellow for the JVM’s own C++ code, orange for the kernel and red for native libraries.
The HTML file is interactive. Click a box to zoom in on it, and use the magnifying glass in the top corner to search for a class or package. Searching for org/apache/cassandra highlights every Cassandra frame and shows what percentage of the samples they account for.
What an idle node looks like
This is a two minute CPU profile from my test node with no client traffic:
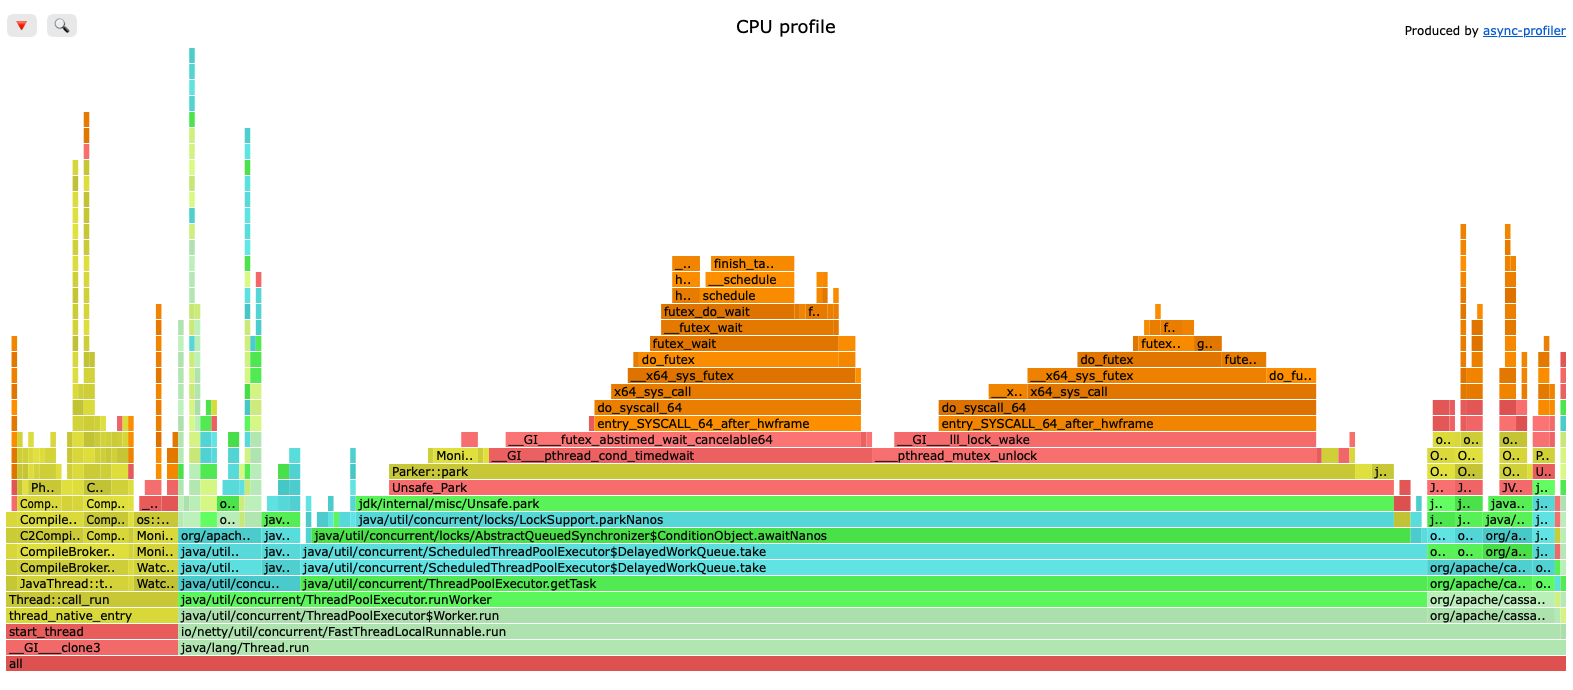
Most of the width is one stack. Reading upwards, it goes from Thread.run through ThreadPoolExecutor.getTask and ScheduledThreadPoolExecutor$DelayedWorkQueue.take into LockSupport.parkNanos, and then down into the kernel through pthread_cond_timedwait and the futex system calls. These are Cassandra’s scheduled executor threads waiting for work. They park with a timeout, wake up, find nothing to do and park again.
A parked thread uses no CPU while it sleeps. What you are seeing is the cost of going into and out of the wait, which is why the top of the stack is kernel scheduling code such as schedule and finish_task_switch. The narrow towers on the left are the JVM itself: the C2 compiler threads still compiling code, and the threads that run the JVM’s periodic housekeeping. The real Cassandra work is the handful of small org/apache/cassandra stacks on the right.
Wide park and futex stacks in a CPU profile do not mean threads are stuck. They mean the node had very little else to do. If that is what you see while chasing a latency problem, a CPU profile is the wrong tool, and a wall profile is the next thing to try.
What a busy node looks like
For comparison, this is a CPU profile from the same node while cassandra-stress was running a write workload:
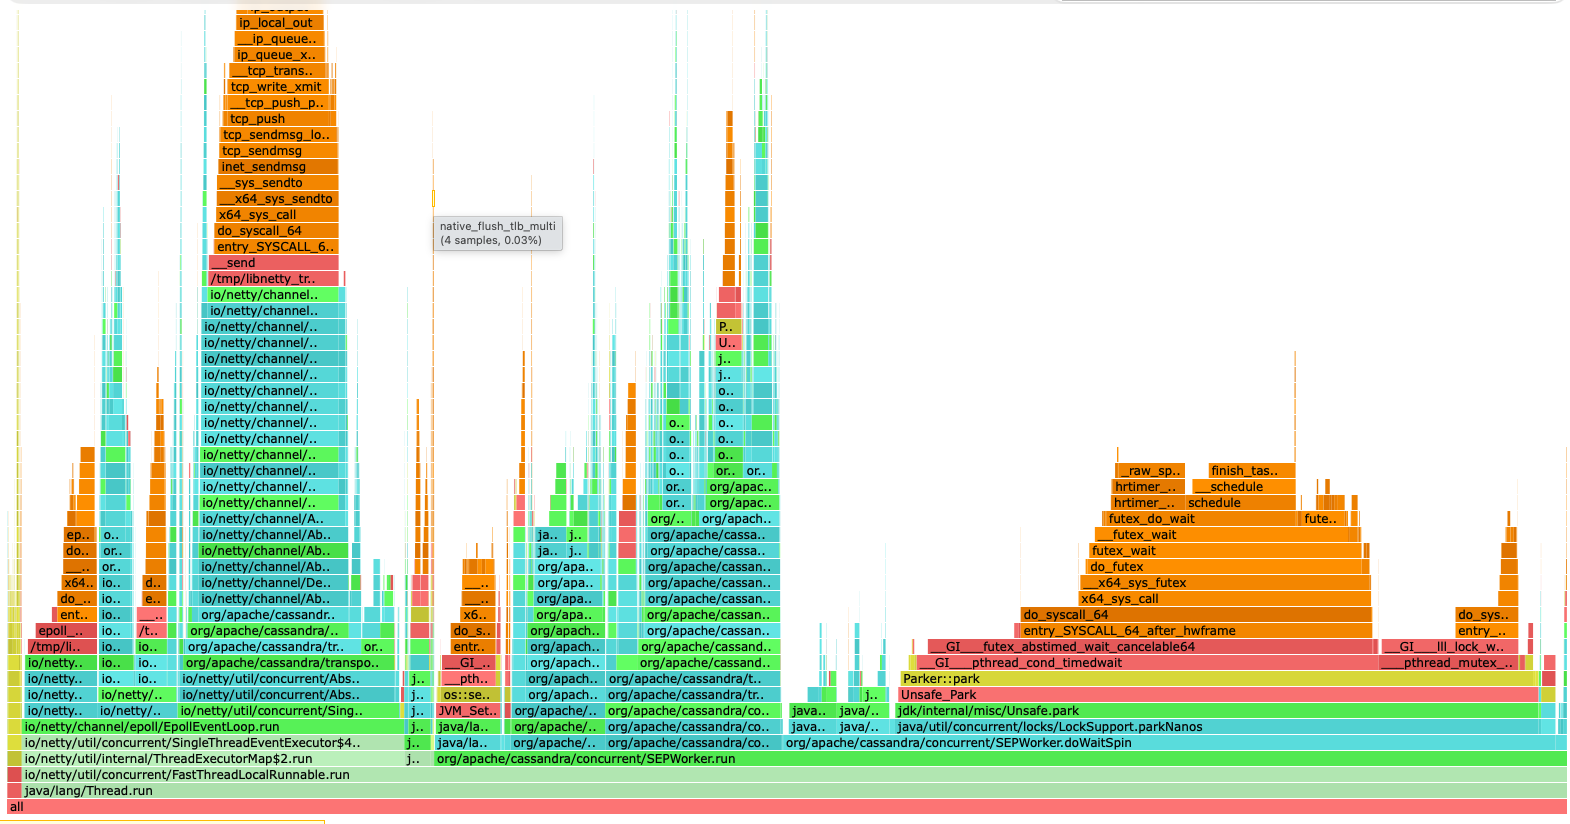
A word on the setup first, this is a single node, with cassandra-stress running on the same machine as Cassandra. That has two effects you should keep in mind, the client and the server compete for the same CPUs, and all of the traffic goes over the loopback interface. The overall shape is still what you would see in production, but the proportions are not.
The graph splits into three areas.
On the left are the Netty event loop threads, under SingleThreadEventExecutor and EpollEventLoop.run. These handle the client connections. The tall orange tower above them is the kernel’s TCP send path, from __send through tcp_sendmsg and ip_output down to dev_queue_xmit, as Cassandra writes responses back through Netty’s native epoll library. At the very top you can see do_softirq. Because this is loopback, the kernel processes the receive side of the connection in the same call, so this tower covers both ends of the conversation. On a real network it would be noticeably smaller.
In the middle is the request work itself, under org/apache/cassandra/concurrent/SEPWorker.run. SEP is Cassandra’s shared executor pool, and this is where the native transport requests are handled and the mutations applied. This is the part to zoom into. Searching for Mutation shows the write path at 14%, and CommitLog at 0.5%.
On the right is something you will recognise from the idle profile. SEPWorker.doWaitSpin leads into LockSupport.parkNanos and the futex calls, with hrtimer frames from the timed park. The shared executor pool spins and parks briefly between tasks so that it can pick up new work quickly, and this is the cost of that. It accounts for 49% of the samples.
That last area is the most useful thing in this graph. With a large share of the samples spent waiting for work, this node was not short of CPU. The limit was somewhere else, and with the load generator on the same machine, the likely candidate is cassandra-stress itself. If you see the same pattern on a production node during a latency problem, a CPU profile has told you what the problem is not, and the next step is a wall profile.
What a wall profile looks like
This is a wall-clock profile of the same node under the same write load:

It looks nothing like the CPU profile, and the reason is the most important thing to understand about wall mode. A CPU profile only samples threads that are running. A wall profile samples every thread, running or not, and gives each one equal weight. A JVM with a lot of idle threads therefore produces a graph that is mostly idle threads.
That is what the left half of this graph is. GangWorker leads into SemaphoreGangTaskDispatcher::worker_wait_for_task and PosixSemaphore::wait. These are the JVM’s parallel garbage collector threads, waiting for a GC to give them some work. PosixSemaphore::wait alone accounts for 47.6% of the samples. My workstation has a lot of cores, the JVM creates GC worker threads to match, and in wall mode every one of them counts.
The middle is the Netty event loops sitting in epoll_wait until the next request arrives. The right is the executor and SEP worker threads parked in Parker::park, waiting for tasks.
Very little of the graph shows threads blocked on a lock, a disk read or another node. That agrees with the CPU profile. Under this workload the node was waiting for cassandra-stress, not for anything inside Cassandra.
If you open your first wall profile and see little more than PosixSemaphore::wait and epoll_wait, do not give up on it. Zoom in on the threads that serve requests, by clicking into the org/apache/cassandra/concurrent stacks or searching for SEPWorker. On a node with a real latency problem, those stacks become wide, and the frames at the top show what they are waiting on.
For anything more involved, record wall profiles in JFR format. nodetool profile start only passes the event, format, duration and file name to async-profiler, so finer options such as filtering by thread are not available from nodetool. With a JFR file you can split or filter the samples by thread on your own machine when you convert it with jfrconv.
Reading JFR files
If you recorded in JFR format, open the file in JDK Mission Control, or convert it to a flame graph on your own machine with jfrconv, which comes with the async-profiler download:
jfrconv --alloc node3-mixed.jfr node3-alloc.htmlThis pulls the allocation samples out of a recording that contains several events and writes them as an HTML flame graph, read in exactly the same way.
Production guardrails
Being able to profile a production node from your laptop is exactly what makes this feature useful, and it is also what makes it worth a few minutes of thought before you turn it on.
Leave unsafe_mode off, the execute subcommand passes whatever you give it straight to async-profiler, and async-profiler’s own commands can write files anywhere the cassandra user can. The start and stop commands are different. They only accept the events, formats and simple file names that nodetool validates, and every result goes into the profiler directory. That is why safe mode is the default, and I would not change it on a production cluster.
Control who has JMX access, everything here goes through JMX. By default Cassandra only accepts JMX connections from the local machine, and opening it up to other machines requires authentication, so the profiler can only be reached remotely by someone with JMX credentials. Anyone who has them can start a profile, fetch the results and purge them. If you use Cassandra’s role-based JMX authorization, you can restrict the profiler to the people who need it by granting permissions on its MBean, org.apache.cassandra.profiler:type=AsyncProfiler, only to those roles.
There is no upper limit on the duration, so a mistyped -d or a profile that someone forgets about will keep running. Agree a sensible ceiling with whoever has access. In practice, a few minutes is enough to capture most problems, and anything measured in hours is a different kind of tool.
Watch the disk, results are written to the log directory and are never cleaned up automatically. Flame graphs are small, but a long JFR recording can be large, and log volumes are often the smallest disks on the host. Purge after you have fetched what you need, or include the profiler directory in your log housekeeping.
Be careful fetching large files, fetch sends the whole file over JMX in one piece, which means the node holds it in memory while it does so. That is not a problem for a flame graph, but on a busy production node I would not fetch a multi-gigabyte JFR recording this way. Keep JFR runs short, or copy large files off the host by another route.
Coordinate who is profiling. Only one session can run on a node at a time, and a second start simply fails. During an incident, when several people may be looking at the same node, agree who is running the profiler so nobody is left wondering why theirs will not start.
Finally, the kernel settings. As I covered in the section on enabling the feature, kernel.perf_event_paranoid and kernel.kptr_restrict decide whether CPU profiles can see into the kernel. Relaxing them is a security decision for whoever owns the hosts, and on some estates it is a change that will not be approved. It is worth finding out which applies to you before you need the profiler, so you know what your profiles will and will not show.
Things I found while testing
I tested everything in this post on a 6.0 build on my own workstation. A few things were not what I expected, and they are worth knowing before you try it yourself.
The kernel settings check was stricter than it needed to be. At startup, Cassandra only logs a warning if kernel.perf_event_paranoid or kernel.kptr_restrict are too restrictive, and the node starts normally. But the same check ran again when I started a profile, and this time nodetool profile start refused to run, even though async-profiler itself only needs these settings to show kernel frames. On a fresh Ubuntu install the default settings fail the check. I raised this as CASSANDRA-21876, and it is being changed so that the profiler logs a warning and still runs.
An idle profiler reports itself as not active. With the profiler enabled and no session running, nodetool profile status returns Profiler is not active. That reads like an error, but it is the expected response. If the profiler had failed to load, you would see a different message saying the native library is not enabled or could not be loaded.
The documentation listed a format that nodetool does not accept. The async-profiler page in Cassandra’s documentation included otlp as an output format, but nodetool rejects it:
$ nodetool profile start -d 2m -e wall -f otlp
nodetool: Invalid value for option '--format': expected one of [flat, traces, collapsed, flamegraph, tree, jfr] (case-sensitive) but was 'otlp'
See 'nodetool help' or 'nodetool help <command>'.
The six formats in that message are the ones you can use. I raised this as CASSANDRA-21873, and the documentation has now been corrected.
There is no limit on how long a profile runs. The review discussion considered capping the duration and concluded it was not needed, so -d 12h was accepted. That is a deliberate decision, not a bug, but it does mean nothing stops someone starting a very long profile.
Troubleshooting
These are the errors I hit while testing, and what each one means.
Async-profiler native library is not enabled or not possible to load.The profiler is not available on the node. Either -Dcassandra.async_profiler.enabled=true is not set, or the node has not been restarted since you added it, or the native library failed to load. Check the running process with ps -ef | grep async_profiler, and look in system.log for an initialization error.
nodetool: Async-profiler experience likely affected. Kernel symbols are unavailable due to restrictions. ...The kernel settings are too restrictive. On a build without the fix for CASSANDRA-21876, profile start refuses to run. Set kernel.perf_event_paranoid=1 and kernel.kptr_restrict=0 with sysctl and start again, with no need to restart Cassandra. Once the fix is in, this is only a warning: the profile runs, but CPU profiles have no kernel frames.
Profiler has already started or there was a failure to start it.A session is already running on that node. Check with nodetool profile status, and either wait for it to finish or stop it.
nodetool: Output file name must match pattern ^[a-zA-Z0-9-]*\.?[a-zA-Z0-9-]*$.The file name contains something other than letters, numbers, dashes and a single dot. Underscores are the usual culprit.
Finally, Profiler is not active is not an error. It is what status returns when the profiler is loaded and no session is running.
Wrapping up
For me, the value of this feature is not async-profiler itself. That has been available for years. It is that profiling a production node no longer depends on getting a new tool installed on it. Once the profiler is enabled, you can go from a latency complaint to a flame graph in a few minutes, without logging on to the node.
The catch is that the property needs a restart, so it has to be in place before you need it. If you think you will want this, get it through your change process now, along with the kernel settings if you want kernel frames, while nothing is on fire.
It lands in Cassandra 6.0, so now is a good time to try it on a test cluster. If you find something that does not behave as you expect, the CASSANDRA-20854 ticket and the Cassandra dev mailing list are the places to raise it.
If you would like help profiling your own clusters, or getting them ready for 6.0, you can book a free 30 minute call or find out more at redshots.com.